13 Mar, 2024
import matplotlib.pyplot as plt
from mpl_toolkits.mplot3d import Axes3D

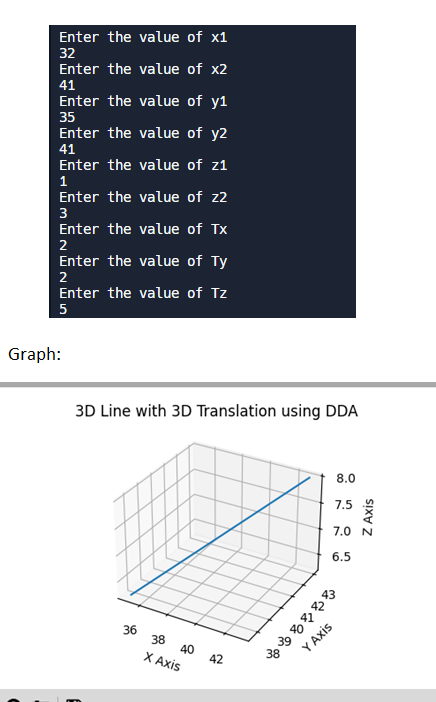
print("Enter the value of x1")
x1 = int(input())
print("Enter the value of x2")
x2 = int(input())
print("Enter the value of y1")
y1 = int(input())
print("Enter the value of y2")
y2 = int(input())
print("Enter the value of z1")
z1 = int(input())
print("Enter the value of z2")
z2 = int(input())

print("Enter the value of Tx")
tx = int(input())
print("Enter the value of Ty")
ty = int(input())
print("Enter the value of Tz")
tz = int(input())

new_x1 = x1 + tx
new_y1 = y1 + ty
new_z1 = z1 + tz

new_x2 = x2 + tx
new_y2 = y2 + ty
new_z2 = z2 + tz

dx = new_x2 - new_x1
dy = new_y2 - new_y1
dz = new_z2 - new_z1

if abs(dx) > abs(dy) and abs(dx) > abs(dz):
    steps = abs(dx)
elif abs(dy) > abs(dz):
    steps = abs(dy)
else:
    steps = abs(dz)

xincrement = dx / steps
yincrement = dy / steps
zincrement = dz / steps

xcoordinate = []
ycoordinate = []
zcoordinate = []

i = 0
while i < steps:
    i += 1
    new_x1 += xincrement
    new_y1 += yincrement
    new_z1 += zincrement
    print("x1:", new_x1, "y1:", new_y1, "z1:", new_z1)
    xcoordinate.append(new_x1)
    ycoordinate.append(new_y1)
    zcoordinate.append(new_z1)

fig = plt.figure()
ax = fig.add_subplot(111, projection='3d')
ax.plot(xcoordinate, ycoordinate, zcoordinate)
ax.set_xlabel("X Axis")
ax.set_ylabel("Y Axis")
ax.set_zlabel("Z Axis")
ax.set_title("3D Line with 3D Translation using DDA")
plt.show()
