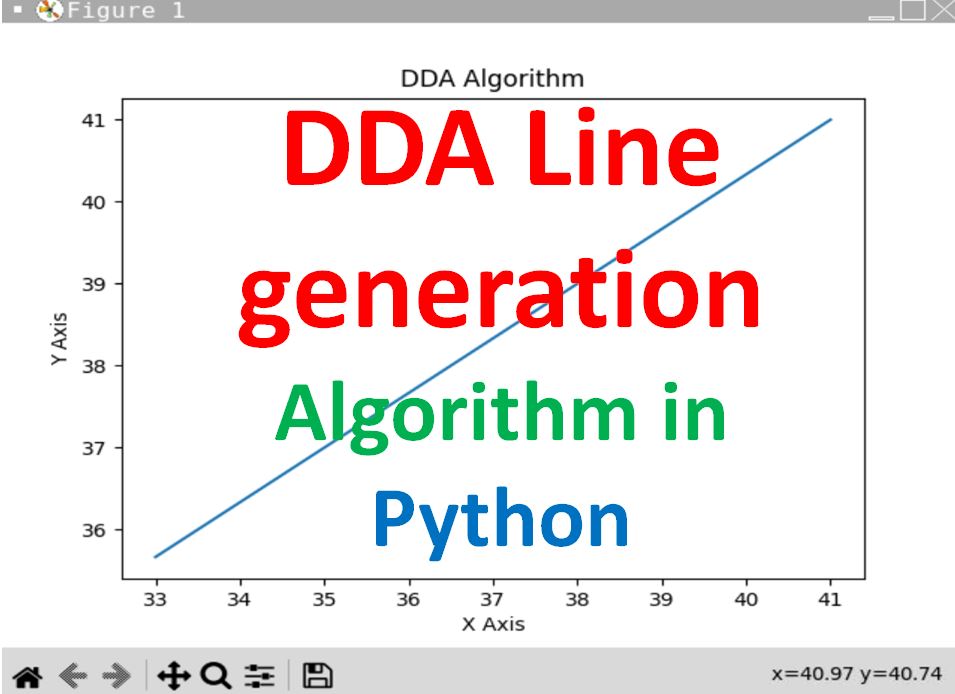
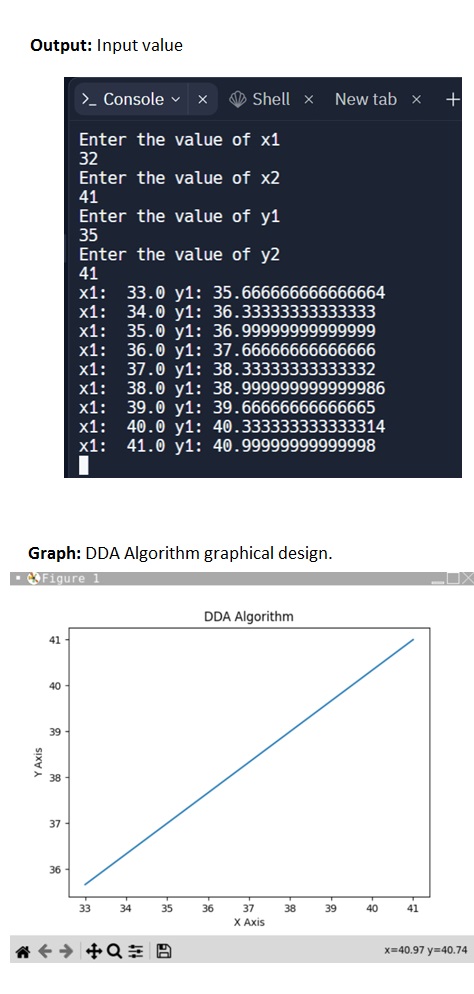
Draw a line using the DDA algorithm where the starting point is (32, 35) and the ending point is (41, 41).
The Digital Differential Analyzer (DDA) algorithm is a fundamental method used in computer graphics for drawing lines on a pixel grid. It is a simple and efficient approach that calculates the coordinates of the pixels that lie on a line segment between two given points. In this report, we will discuss the DDA algorithm, its principles, and its implementation in Computer Graphics Lab.
import matplotlib.pyplot as plt
print("Enter the value of x1")
x1=int(input())
print("Enter the value of x2")
x2=int(input())
print("Enter the value of y1")
y1=int(input())
print("Enter the value of y2")
y2=int(input())
dx= x2-x1
dy=y2-y1
if abs(dx) < abs(dy):
     steps = abs(dx)
else:
     steps = abs(dy)
xincrement = dx/steps
yincrement = dy/steps

xcoordinates = []
ycoordinates = []

i=0
while i>steps:
     i+=1
     x1=x1+xincrement
     y1=y1+yincrement
     print("x1: ",x1, "y1:", y1)
     xcoordinates.append(x1)
     ycoordinates.append(y1)
plt.plot(xcoordinates,ycoordinates)
plt.xlabel("X Axis")
plt.ylabel("Y Axis")
plt.title("DDA Algorithm")
plt.show()
 How to run the code in Replit:
Replit is an online platform that provides a coding environment for various programming languages, including Python. To run Python code in Replit, follow these steps:
Create a Replit Account (if you don't have one):
- Visit the Replit website (https://replit.com).
- Click the "Sign Up" or "Log In" button to create an account or log in if you already have one.
Create a New Python Replit:
- After logging in, click the "New Repl" button to create a new project.
- Choose "Python" as the programming language.
Writing Python Code:
- You'll be presented with an online code editor where you can write your Python code. Write or paste your Python code into the editor.
Running Python Code:
- To run your Python code, click the green "Run" button (a triangle icon) located near the top of the screen.
Viewing Output:
- The output of your Python code will appear in the console below the code editor. This is where you can see the results of your program.
Save and Share:
- Replit automatically saves your work as you go along, but you can also use the "Save" button to manually save your project.
- You can share your Replit with others by clicking the "Share" button, which generates a link to your project.
Collaboration (if needed):
- If you're working with others, Replit allows real-time collaboration. You can invite collaborators by clicking the "Invite" button and sharing the invite link.
Stopping Your Code:
- If your code is running indefinitely or you want to stop it, you can click the "Stop" button (a square icon).
That's it! You can write, run, and experiment with your Python code in Replit's online environment. It's a great platform for quickly trying out code, collaborating with others, and learning Python without needing to install anything on your local computer.
Code Explain :
This Python code demonstrates the DDA (Digital Differential Analyzer) Line Generation Algorithm, which is used to draw a straight line between two given points (x1, y1) and (x2, y2) on a Cartesian plane. Here's an explanation of the code:
Importing Libraries:
- The code begins by importing the "matplotlib.pyplot" library, which is used to create plots and graphs.
Input Coordinates:
- The code prompts the user to enter the coordinates of two points, (x1, y1) and (x2, y2), representing the endpoints of the line.
Calculate Differences:
- The code calculates the differences in the x and y coordinates between the two endpoints:
- dx: The difference between x2 and x1.
- dy: The difference between y2 and y1.
Determine the Number of Steps:
- The number of steps required to draw the line is determined based on whether the difference in x (dx) or the difference in y (dy) is greater. This helps ensure that the line is evenly spaced in both the horizontal and vertical directions.
- The "steps" variable is set to the absolute value of the larger of the two differences.
Calculate Increments:
- The code calculates the increments for x and y for each step to move from (x1, y1) to (x2, y2).
- "xincrement" is the change in the x-coordinate for each step.
- "yincrement" is the change in the y-coordinate for each step.
Initialize Empty Lists:
- Two empty lists, "xcoordinates" and "ycoordinates," are initialized. These lists will store the x and y coordinates of each point on the line.
Draw the Line:
- A loop is used to iterate from 0 to the number of "steps."
- In each iteration:
- x1 and y1 are updated by adding their respective increments.
- The current coordinates (x1, y1) are printed to the console.
- The current coordinates are added to the "xcoordinates" and "ycoordinates" lists.
Plot the Line:
- After calculating all the coordinates, the code uses "plt.plot" to create a plot of the line. It uses the "xcoordinates" as the x-values and "ycoordinates" as the y-values.
- Additional commands set labels for the axes and provide a title for the plot.
Display the Plot:
- Finally, "plt.show()" is called to display the line plot.
When you run this code, you'll be able to enter the coordinates of two endpoints, and the DDA algorithm will calculate and plot the line that connects them. This can be a helpful exercise for understanding how lines are drawn on a computer screen.