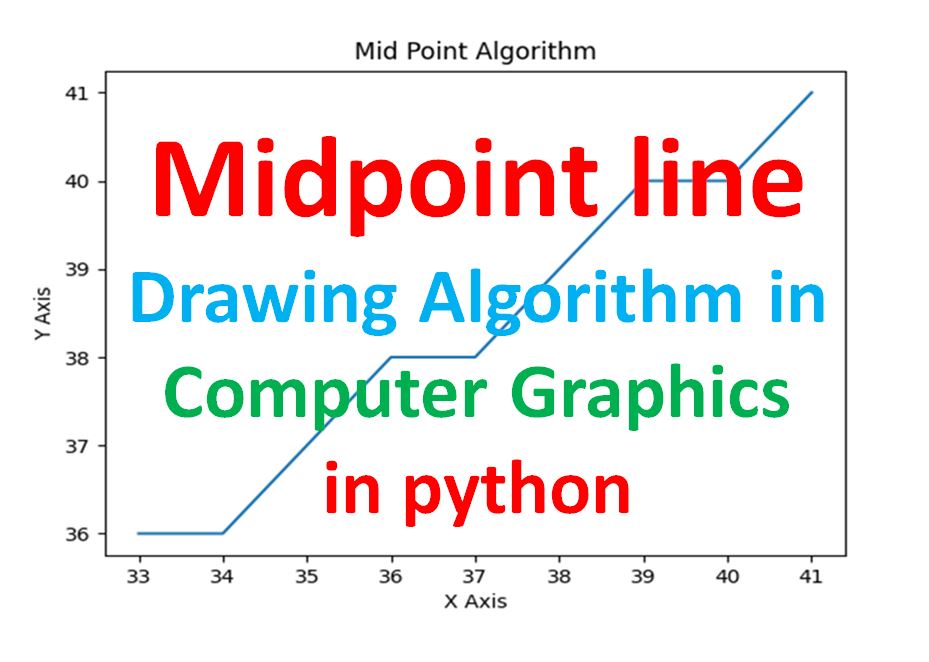
Midpoint line Drawing Algorithm in Computer Graphics in python
Draw a line using the Midpoint algorithm where the starting point is (32, 35) and the ending point is (41, 41).
Theory: The Mid-Point line plotting algorithm was introduced by “Pitway and Van Aken.” It is an incremental line drawing algorithm. In this algorithm, we perform incremental calculations. The calculations are based on the previous step to find the value of the next point. We perform the same process for each step.
The Midpoint Line Algorithm is designed for efficiency and simplicity when drawing lines on a pixel grid. It avoids the need for floating-point calculations or trigonometric functions, making it suitable for real-time graphics.
The decision parameter P is crucial in determining whether the next pixel should move horizontally (x) or diagonally (x and y) based on the relative positions of the endpoint and the line. When P is positive or zero, it means the midpoint is above or on the actual line, so we move diagonally. When P is negative, it means the midpoint is below the actual line, so we move horizontally.
By following this process, the algorithm efficiently plots the points that best approximate the line between the given start and end points, making it a preferred choice for line drawing in computer graphics.
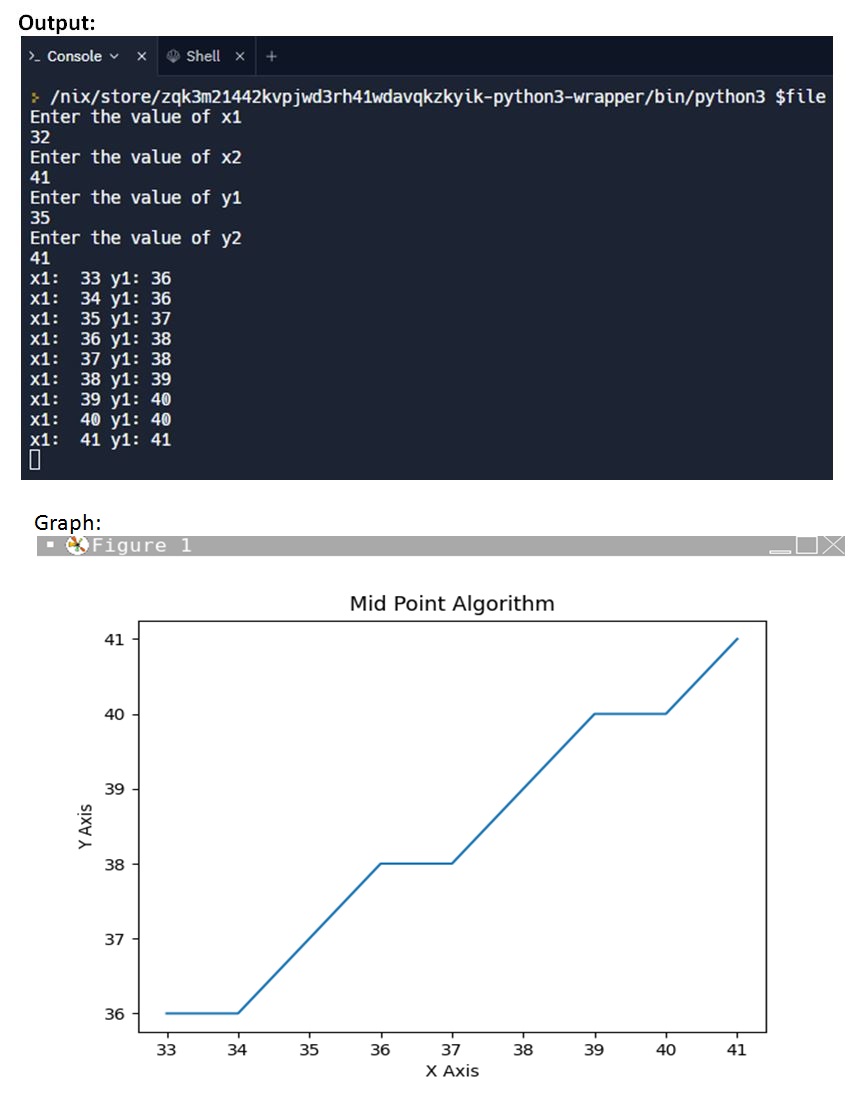
Input:
• Starting point (x1, y1) and ending point (x2, y2) of the line.
Output:
• A set of pixel coordinates (x, y) approximating the line between (x1, y1) and (x2, y2).
Algorithm:
1. Initialize variables:
• x to x1, y to y1.
• Calculate differences: dx = x2 - x1, dy = y2 - y1.
• Calculate the decision parameter P: P = 2 * dy - dx.
2. Plot the starting point (x, y).
3. Loop:
• While x < x2, update the pixel coordinates and P:
• If P < 0, increment x by 1, update P.
• If P ≥ 0, increment both x and y by 1, update P.
4. Continue looping until x ≥ x2.
5. The line is complete.
The algorithm efficiently draws lines by considering the relationship between the decision parameter P and the line's slope, avoiding complex calculations like floating-point or trigonometric operations.
import matplotlib.pyplot as plt

print("Enter the value of x1")
x1 = int(input())
print("Enter the value of x2")
x2 = int(input())
print("Enter the value of y1")
y1 = int(input())
print("Enter the value of y2")
y2 = int(input())
dx = x2 - x1
dy = y2 - y1
dy2 = dy * 2
dk = dy2 - dx
dd1 = dy - dx
dd2 = 2 * dd1
if abs(dx) > abs(dy):
  steps = abs(dx)
else:
  steps = abs(dy)
xincrement = dx / steps
yincrement = dy / steps

xcoordinate = []
ycoordinate = []

i = 0
while i < steps:
  i += 1
  if dk < 0:
    x1 = x1 + 1
    y1 = y1
    dk = dk + (2 * dy)
    print("x1: ", x1, "y1:", y1)
    xcoordinate.append(x1)
    ycoordinate.append(y1)
  else:
    x1 = x1 + 1
    y1 = y1 + 1
    dk = dk + dd2
    print("x1: ", x1, "y1:", y1)
    xcoordinate.append(x1)
    ycoordinate.append(y1)

plt.plot(xcoordinate, ycoordinate)
plt.xlabel("X Axis")
plt.ylabel("Y Axis")
plt.title("Mid Point Algorithm")
plt.show()
 Explanation of the code:
This Python code implements the Midpoint Line Drawing Algorithm, which is used to draw a straight line on a graphical display. Here's a explanation of the code:
Import the matplotlib.pyplot library for plotting.
Get user input for the coordinates of two points (x1, y1) and (x2, y2) to define the line.
Calculate the differences between the x-coordinates (dx) and y-coordinates (dy) of the two points, as well as the values dy2, dk, dd1, dd2, and steps.
Initialize empty lists xcoordinate and ycoordinate to store the coordinates of points on the line.
Use a loop that iterates steps times, where steps is determined by the steeper of the two slopes (dx or dy). This loop calculates and appends the coordinates of points along the line using the Midpoint Algorithm.
Within the loop, it checks the value of dk. If dk is less than 0, it updates the coordinates (x1, y1) and adjusts dk. If dk is greater than or equal to 0, it updates the coordinates (x1, y1) and adjusts dk.
It prints the updated coordinates (x1, y1) within each iteration of the loop.
After calculating all the points, it plots the line using plt.plot and labels the X and Y axes, and sets the plot title.
Finally, it displays the plot using plt.show().
This code essentially draws a line between two user-defined points using the Midpoint Line Drawing Algorithm and visualizes it using matplotlib.
How to run python code in Replit:
Replit is an online platform that provides a coding environment for various programming languages, including Python. To run Python code in Replit, follow these steps:
Create a Replit Account (if you don't have one):
- Visit the Replit website (https://replit.com).
- Click the "Sign Up" or "Log In" button to create an account or log in if you already have one.
Create a New Python Replit:
- After logging in, click the "New Repl" button to create a new project.
- Choose "Python" as the programming language.
Writing Python Code:
- You'll be presented with an online code editor where you can write your Python code. Write or paste your Python code into the editor.
Running Python Code:
- To run your Python code, click the green "Run" button (a triangle icon) located near the top of the screen.
Viewing Output:
- The output of your Python code will appear in the console below the code editor. This is where you can see the results of your program.
Save and Share:
- Replit automatically saves your work as you go along, but you can also use the "Save" button to manually save your project.
- You can share your Replit with others by clicking the "Share" button, which generates a link to your project.
Collaboration (if needed):
- If you're working with others, Replit allows real-time collaboration. You can invite collaborators by clicking the "Invite" button and sharing the invite link.
Stopping Your Code:
- If your code is running indefinitely or you want to stop it, you can click the "Stop" button (a square icon).
That's it! You can write, run, and experiment with your Python code in Replit's online environment. It's a great platform for quickly trying out code, collaborating with others, and learning Python without needing to install anything on your local computer.