Given a line segment A(32,35) and B(41,41) Apply 2D Scaling where Sx = 2and Sy=2 and obtain new co ordinate and the new line.
Theory: Sure, scaling in 2D transformations involves resizing an object or a geometric figure by a factor along the x-axis (horizontal) and y-axis (vertical). It changes the size of the object without altering its shape or orientation. The scaling factors, denoted as Sx and Sy, determine how much the object expands or shrinks along each axis.
The formula for scaling a point x, y by scaling factors Sx and Sy is:
(x', y') = Sx * x, Sy * y
Where:
x', y'are the new coordinates after scaling.
x, yare the original coordinates.
Sx is the scaling factor along the x-axis.
Sy is the scaling factor along the y-axis.
To apply scaling to a line segment defined by two endpoints A(x1, y1 and B(x2, y2):
1. Calculate the new coordinates of A and B separately using the scaling formula.
2. Join the new coordinates of A’ and B’ to form the scaled line segment.
For instance, if you have a line segment AB with endpoints A(32, 35) and B(41, 41), and you want to scale it by Sx = 2 and S_ = 2:
- Apply the scaling formula to each point to find the new coordinates A’and B’
- The scaled line segment will then be formed by joining the new coordinates A' and B', resulting in a line segment with adjusted size but the same direction and orientation as the original segment.
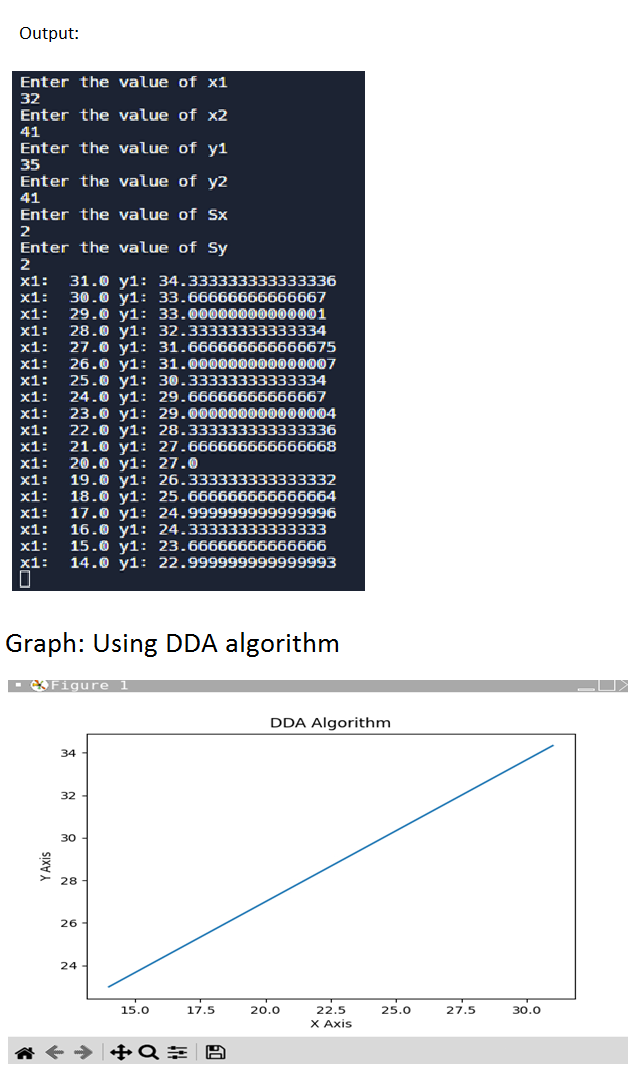
Code: using python
import matplotlib.pyplot as plt
print("Enter the value of x1")
x1=int(input())
print("Enter the value of x2")
x2=int(input())
print("Enter the value of y1")
y1=int(input())
print("Enter the value of y2")
y2=int(input())
print("Enter the value of Sx")
sx=int(input())
print("Enter the value of Sy")
sy=int(input())
new_x1=x1*sx
new_y1=y1*sy

new_x2=x2*sx
new_y2=y2*sy

dx= new_x1-new_x2
dy=new_y1-new_y2

if abs(dx) > abs(dy):
     steps = abs(dx)
else:
     steps = abs(dy)
xincrement = dx/steps
yincrement = dy/steps

xcoordinate = []
ycoordinate = []

i=0
while i<steps:
     i+=1
     x1=x1+xincrement
     y1=y1+yincrement
     print("x1: ",x1, "y1:", y1)
     xcoordinate.append(x1)
     ycoordinate.append(y1)
plt.plot(xcoordinate,ycoordinate)
plt.xlabel("X Axis")
plt.ylabel("Y Axis")
plt.title("DDA Algorithm")
plt.show()